
 Training and Racing with a Power Meter
H. Allen and A. Coggan
Pub Velopress 2006
I have been using heart rate monitors for cycle training in an effective manner over the last decade. For a few years prior to that, my usage of HRMs just consisted of looking at the heart rate. What induced my HRM-based training to really take off and lead to improved time trialling was using Pete Read's Black Book (aka The Annual Manual), which delivers a programme of turbo training sessions arranged in monthly progression. Inherent in that programme is the need to for the cyclist to know what his or her maximum heart rate is, and from this to deduce five levels (0-4). This is actually quite hard to do - it seems to me that it does take quite a bit of experience to really appreciate how hard an effort can be sustained.
Recently I bought a Polar CS600X bike computer with the Polar Power meter attachment. This isn't the kind of kit I'd like to fit to a bike that will be used in the hurly burly of a time trial environment - I can't help feeling that the exposed cables would be quite vulnerable when heaving the bike in and out of car boots for example. It's also not suitable for moving between bikes, as installation, while not particularly difficult, is quite time-consuming. I chose to install the kit on the bike I keep mounted on the turbo trainer. This is the set up that I do just about all of my "real" training - the kind of training sessions which I monitor carefully using the HRM. Having now played around with the kit for a few months, I thought I'd try and get a bit more background understanding of the kinds of data analysis that power metering enables, and to take things beyond the "looking at the numbers" phase.
Here I should point out that I have been, and to an extent remain, rather sceptical of the merits of power-based training over heart rate-based training. My scepticism stems from the belief that since the point of a training programme is to train the physiological systems of the cyclist, then the direct biological read-out of effort (as perceived by the cyclist's body in the form of heart rate) must be the most important measure of training effort. I realise of course that heart rate doesn't align exactly with effort: effects of dehydration, temperature and tiredness need to be taken into account. But I've always felt that with experience, these are not show-stoppers.
Anyway, with this in mind, I bought a copy of Hunter & Coggan's Training and Racing with a Power Meter. I chose this book on the back of hearing about it on the internet, and because Andy Coggan is one of the more vocal champions of power training for cyclists. Indeed, one can barely Google on the subject without hitting numerous forum posts from him. The book was published in 2006, and accordingly may be a little outdated - suggestions for more recent publications will be happily received (I notice a new edition is due March 2010)! This article is sort of a book review coupled with observations on the nature of power-based training from the viewpoint of an experienced time triallist with an extensive science background, but with no prior experience of power-based training.
Training and Racing with a Power Meter is a small paperback of around 230 pages, copiously illustrated. Unfortunately it's only illustrated in monochrome, which does present some limitations when showing screen grabs from software packages - very often I wasn't able to see what the text was describing. The authors are linked to the well-established CyclingPeaks software package, a relationship they are entirely open about. The book takes the reader through aspects of physiology, hardware and software, generally in a clear manner, though at times the writing is rather technical tends to lack clear explanation of mathematical treatment of data. All the examples of data processing relate to the CyclingPeaks software package - I don't believe this is a show-stopper as most of the appropriate data handling can be done with other packages (of which more later).
The book opens with a chapter which sets out the authors' stall regarding the benefits of using power metering in a training programme. Essentially, this is that information regarding power output has got to be informative when designing a training programme and assessing progress. As an aside, my own view is that both HRM-based and power-based training offer the ability to set exercise intensity while training, and assess the true training benefit afterwards. For a number of reasons, which I'll elaborate later, I suspect that HRMs are more useful for the former and power meters the latter. Of course, you can't use power measurements without the means to collect and to analyse appropriate data. Chapter two reviews the then current hardware used for measuring power, and various software packages for analysing the data. The hardware systems are reviewed very openly: each system has advantages and disadvantages relative to other systems - such as cost, their accuracy, the ability to transfer the kit between bikes, etc. Undoubtedly, this section will be somewhat dated (for example, the Polar WIND system I use is as far as I can tell an improved version of the Polar system reviewed in the book). Various software packages are reviewed, the the authors' own package comes out a clear leader - not surprising, since it reflects their preferences in analytical techniques.
It's clear that the majority of these software packages are for PCs running Windows - one or two are available for the Mac, but as far as I can see, no mention is made of Linux, which is a shame (though remember this was presumably written back in 2005). As it happens the Windows software I use, Vidaone Diet and Fitness, has very little facility for analysing power data, though I've recently been using the open source Golden Cheetah package, which can process power downloads, and which has versions for Linux, Windows and Mac.
In the third chapter, we start to get to the meat of the subject. Essentially, it recapitulates for power what many cyclists will have done with heart rate: determine the threshold power, and to use this to define a set of training levels. The advice appears to be to firstly ride the bike to get a feel for what different power levels feel like, particularly in relation to HR and speed, then to measure the Functional Threshold Power (FTP). FTP is defined here as the highest power a rider can sustain in a quasi-steady state for an hour. [Actually, the text seems quite clear that the HR threshold and the FTP are really non-invasive proxies for the lactate threshold (LT).] Several methods for estimating FTP are given:
1. Upload all training data with power records into the training software, and generate a histogram of power distribution, using appropriate power bins (e.g. 15 to 20 watt intervals). This histogram looks like a skewed normal distribution: FTP is estimated by the power at which the biggest drop-off is seen. (This estimates my FTP at about 260W). This is perhaps the easiest way to determine FTP, but I am concerned that in my case it's going to be skewed by the nature of my turbo training, which is usually dictated by the HRM and in many cases will have restricted upper and lower effort limits depending on what session I'm riding. Here's an example: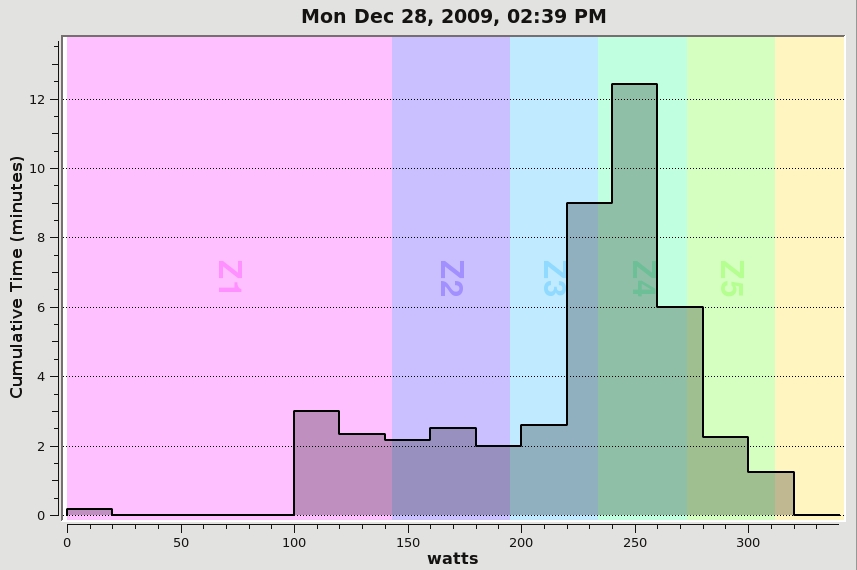
2. By merely looking at power meter traces to see what the highest power can be sustained for lengthy periods.
3. Looking at Normalized Power (NP - this is a means of averaging power that is described later in the book) for the duration of a mass start race. Not really applicable to my bike riding!
4. Studying the power meter trace from a 1h time trial (or actually several events, I guess) to see the sustainable power level for real. However, I don't plan to fit a power meter to my TT bike.
5. The final method involves determining the "critical power", which involves determining total work performed in a number of durations from 30 seconds to 30 minutes, plotting these values against the time intervals and determining the gradient of the resulting line: this is a close estimate for FTP. The book gives a detailed exposition of calculating CP.
Of these methods, the first and fourth are probably the easiest for me to perform: I've used the first method, and have come to the conclusion that my FTP is 260W. Or, should I say, 260 Polar Watts, since I have no real idea how accurately the measured Watts are related to "real" Watts! Once the cyclist's FTP is known, seven power training levels are established:
Level 1 Active Recovery
Level 2 Endurance
Level 3 Tempo
Level 4 Lactate Threshold
Level 5 VO2Max
Level 6 Anaerobic Capacity
Level 7 Neuromuscular Capacity
I won't go into the specifics here, but essentially, riding at FTP correlates with Level 4, while Level 6 is 121-150% of FTP. Level 7 isn't rated by power - it's very short explosive efforts. Quite detailed descriptions of each level in terms of perceived exertion are given in the text.
Over the next few chapters, a fair few methods of analysing and summarising power data are described (oddly, many of these terms appear to be trademarked!). These are as follows:
Normalized Power (NP): Because individiual power readings fluctuate much more than do HR readings (which are damped by the physiological responses to exercise stress), some form of smoothing is needed. Some software packages appear to smooth the data by rolling averages. Normalized Power is a means of assessing the intensity of a workout - NP is calculated by taking 30 second rolling average power values, raising these to the fourth power, averaging them, then taking the fourth root. I imagine this was arrived at empirically: I can't see a particular reason for using the fourth power!
Intensity Factor (IF): defined as the ratio of NP to FTP - so it kind of relates the training intensity to the rider's threshold power. So IF=NP/FTP. The text suggests using IF to monitor changes in fitness, with the example of a rider completing a 1h time trial at IF 1.05 - this suggests FTP is actually higher than previously assessed.
Training Stress Score (TSS): TSS = (s x NP x IF) / (FTP x 3600), where s is duration in seconds.
Quadrant Analysis: here's where the data processing gets interesting. QA appears from my reading to begin to relate a training session to actual neuromuscular activity. The QA is a scatterplot of Average Effective Pedal Force (AEPF) versus Circumferential Pedal Velocity (CPF). These are calculated as follows:
AEPF = (P x 60) / (C x 2 x Π x CL)
CPV = C x CL x 2 x Π /60
where P = power (watts), C = cadence (rpm), CL = crank length (meters). CPL is used as a proxy for muscle shortening velocity, so it's a realistic physiological measure.
Unfortunately he book isn't too clear to my reading on what the plot represents in useful terms. the scatterplot is divided into four quadrants, as far as I can tell on the basis of FTP and cadence of 80rpm. Also superimposed on the plot is a curve representing a particular power at varying cadence (I presume this is the FTP). Each quadrant is interpreted in terms of particular riding activity, though none appear to correlate with steady long riding, such as performed in time trialling. The Golden Cheetah package produces this chart with the seven training levels superimposed: my interpretation of such plots indicates the amount of training performed at or above threshold, which correlated with Level 4. 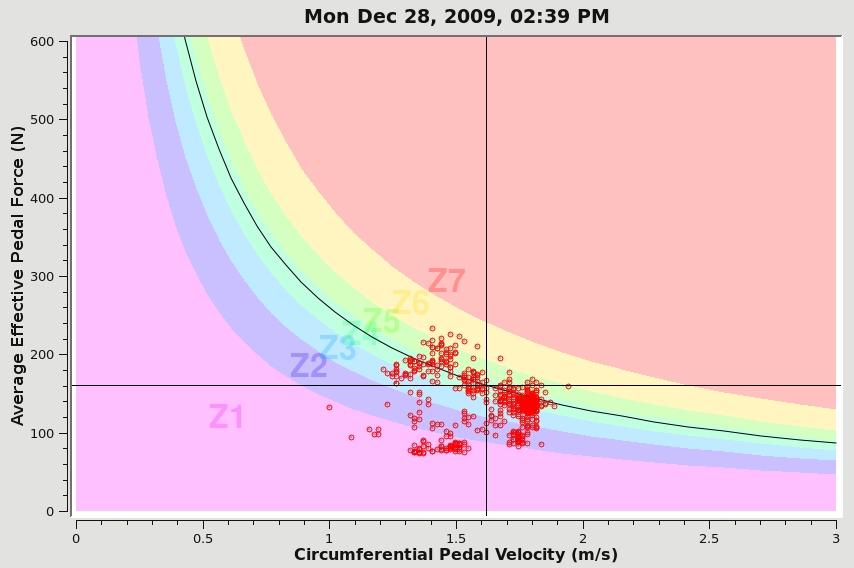
You get quite an interesting view of the spread of intensities - this plot is of an interval session, with the intense periods lying on or above the curve, and the recovery intervals lying well below - as seems to be typical with this session, the scatter as a whole tends to have a V- or Y-shaped distribution.
Critical Power (CP): I'm not going to go into this in any detail here: Allen and Coggan spend three pages reviewing different methods of calculating CP.
The remainder of the book deal with using power data in monitoring and informing training and racing programmes. Much of this material involves post-hoc data analysis to deduce how well a session went. Implicit here is a strategy in which this analysis is used to change future sessions, for example by suggesting that the cyclist take a session more easily, more steadily, or with more effort. There's also an element of using power measurement to keep an eye on the response to training, for example by monitoring changes to critical power, FTP etc.
I suppose this is where a bit of a reality check is in order. As the authors note, live power values can fluctuate and spike much more readily than do HRM readings. My own view is that using live power readings to drive exercise intensity is something that must be gained by experience and practice: the danger might well be that a cyclist might be persuaded to chase after ever increasing power levels.
Over the coming weeks, I expect to integrate the use of the power meter in my training programme: Part 2 of this article will incorporate this experience in discussions of the role of power meters in cycle training.